
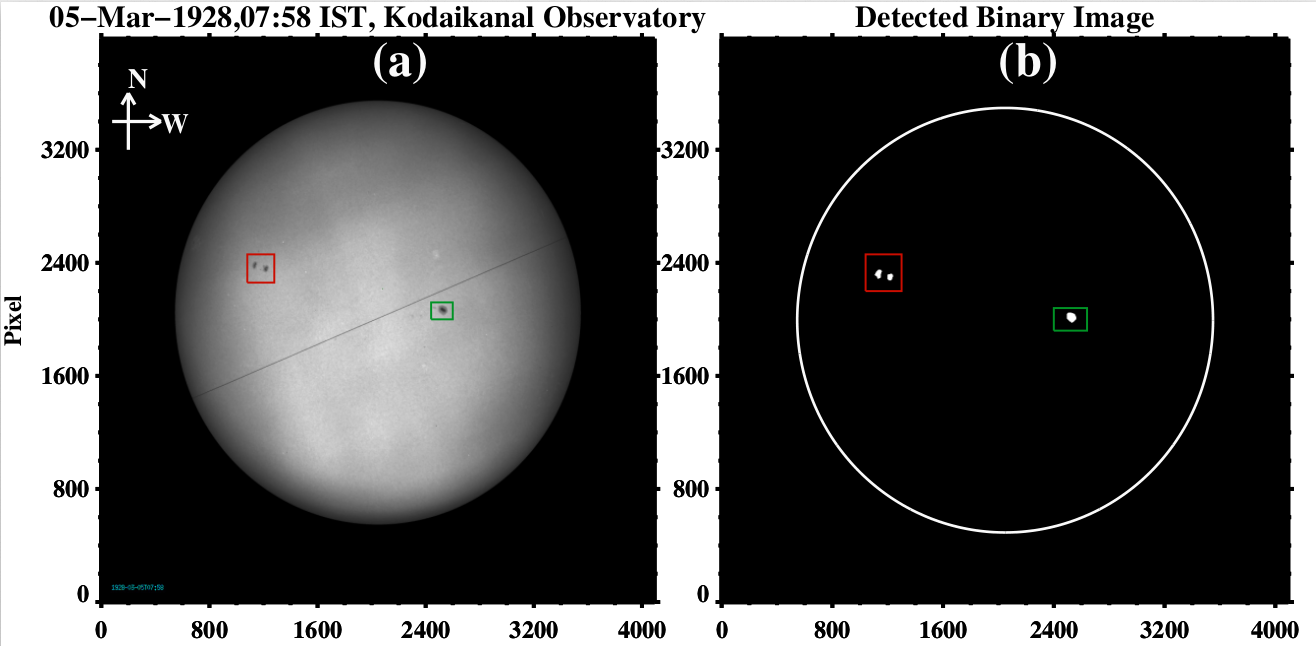
The white-light telescope consists of a 10-cm objective lens with f/15 beam that is capable of producing 20.4 cm diameter images of the Sun after enlarging the primary image with the additional optics. Depending on the sky condition, images are captured on photographic plates since 1904 (click to get observation statistics). The images were digitized using a 4k × 4k format CCD-camera-based digitizer unit. More details regarding white light data can be found in Ravindra et. al. (2013), A&A, 550, 19 and Sivaraman et. al. (1993).
Semi-automated Sunspot Detection:
Using a semi-automated sunspot detection algorithm on this digitized data different sunspot parameters, like the whole spot area (corrected for projection), latitude and longitude have been extracted by Mandal et al. (2016).
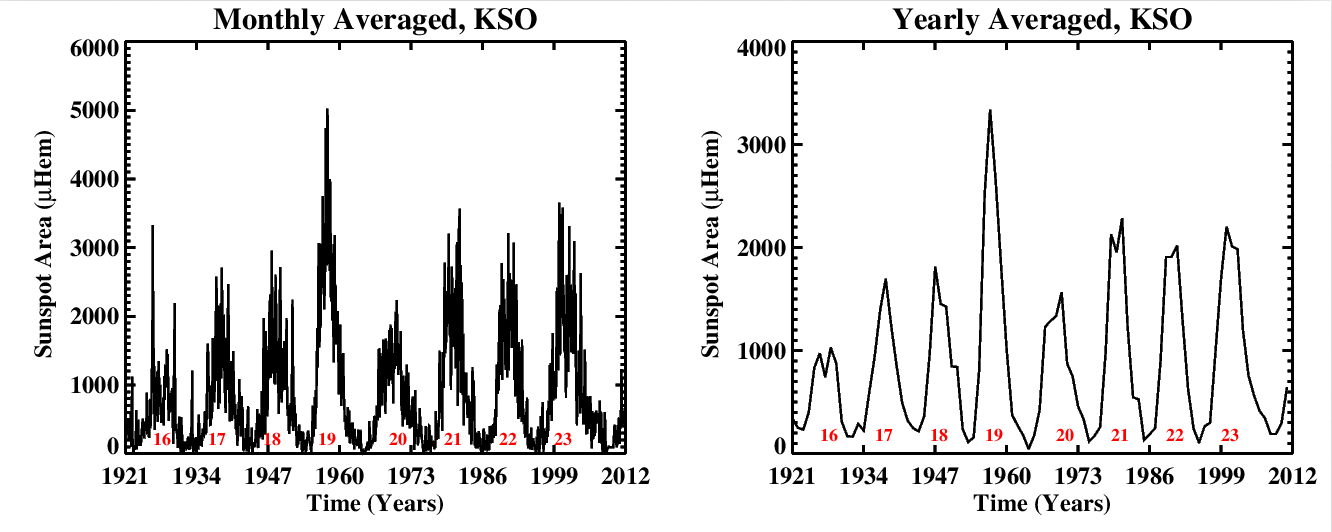
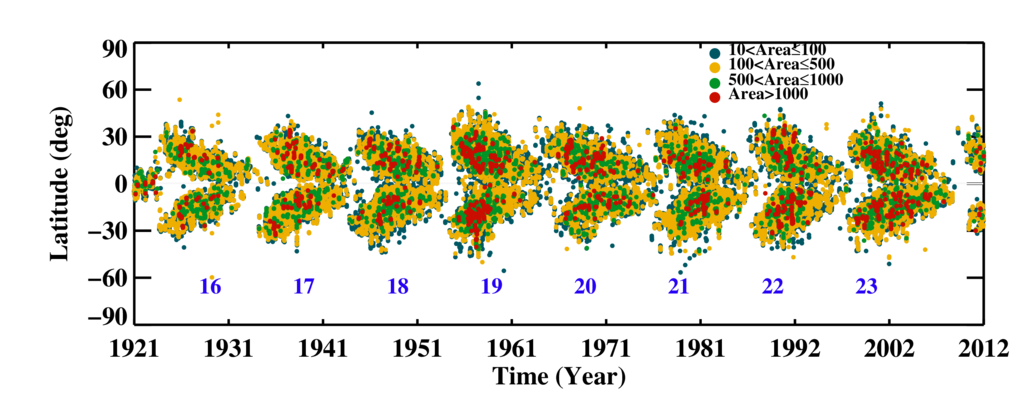
Butterfly Diagram from Kodaikanal Sunspot Data:
Sunspots appear at higher latitudes during the onset of a solar cycle. As the cycle progresses, the activity belt migrates towards the solar equator and eventually produces sunspots close to the solar equator during the solar minima. This migration pattern in a time-latitude diagram is known as the 'Butterfly diagram'.
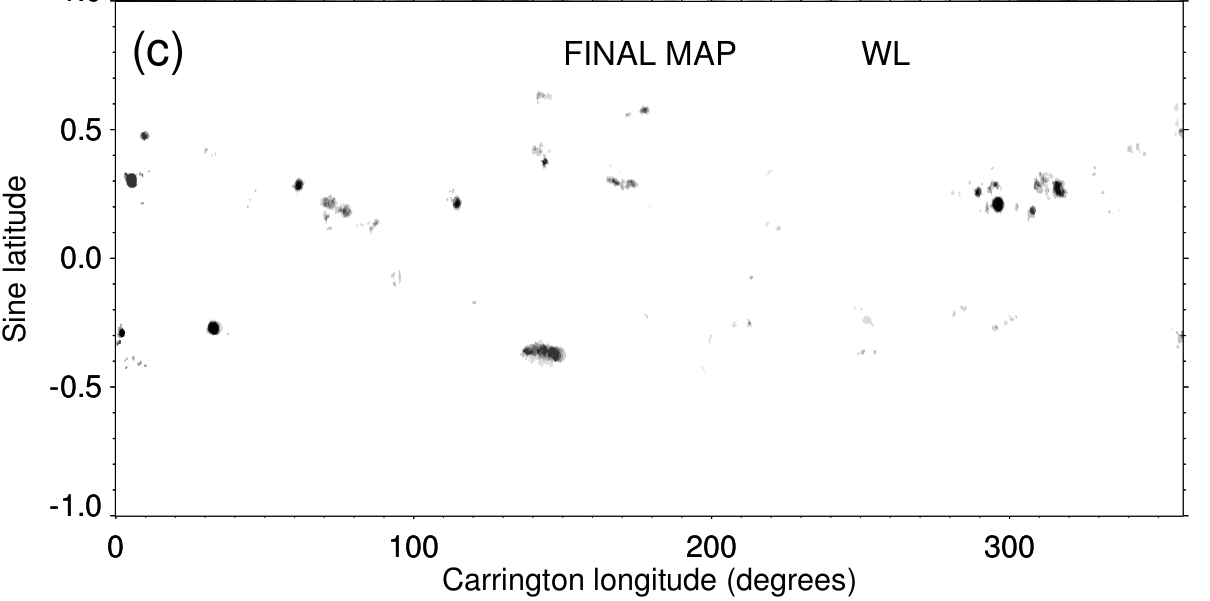
Carrington Maps Using Sunspot Data:
The Carrington map is a Mercator projection of the spherical Sun, generated from daily observations for one solar rotation. Such maps,from KSO WL data has been used by Mandal et al 2017ApJ...835...62M to study the different characteristics of solar active longitudes.
A 100 years of journey:
In this movie we show how the sunspot locations change with the progress of solar cycles. The white dotted circle represents the detected solar limb from the white-light image where as the red dashed line represents the solar equator.
Note: If you face problem playing the movie in your browser, download it from here
or via ftp : Daily Sunspot data (click), Monthly Sunspot area (click), Yearly Sunspot area (click)
- Kodaikanal Digitized White-light Data Archive (1921-2011): Analysis of various solar cycle features
Sudip Mandal, Manjunath Hegde, Tanmoy Samanta, Gopal Hazra, Dipankar Banerjee, B Ravindra A&A 2017
- Digitized archive of the Kodaikanal images: Representative results of solar cycle variation from sunspot area determination
Ravindra, B.; Priya, T. G.; Amareswari, K.; Priyal, M.; Nazia, A. A.; Banerjee, D., 2013A&A...550A..19R